Run a process
To execute a process, click the play symbol in the execution toolbar.

Once the process starts, the play symbol changes to a pause symbol. Click the pause symbol to suspend execution at any time.
The toolbar may appear grayed out immediately after clicking play, indicating that the process is initializing.
To cancel the process execution entirely, click the stop symbol, which is available during active execution.
When debugging a process, it is useful to step through execution incrementally. Use the Step process forward button to begin execution in step mode, or start execution normally and pause at a point of interest. From the paused state, you can continue stepping using either the Step process forward button for step-by-step advancement or the Step over next button to skip over sub-processes, depending on your debugging needs.
Skip process nodes in a run
To skip a specific node, click the disable button on the selected node before starting the process. The disable button appears when a node is selected. Skipped nodes produce no output; therefore, any downstream nodes that depend on their output must also be skipped.
Node disabling can only be configured before the process starts. Although the disable button may remain visible during execution or pause, any changes will not take effect until the next process initialization.
Set breakpoints to interrupt process runs
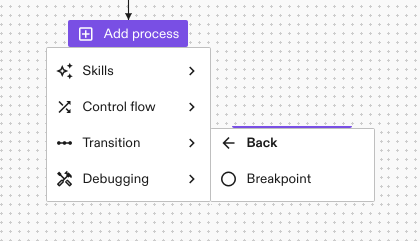
Breakpoints allow you to pause process execution at predetermined locations, which is useful for inspecting the scene state at critical execution points. To add a breakpoint, click the purple plus button at the desired location in the process. In the Debugging section, select Breakpoint to add it.
When a process contains active breakpoints, the play action in the action toolbar displays a dot badge indicating the number of active breakpoints. Breakpoints can be disabled and will be skipped like other nodes. Disabled breakpoints will not interrupt execution.
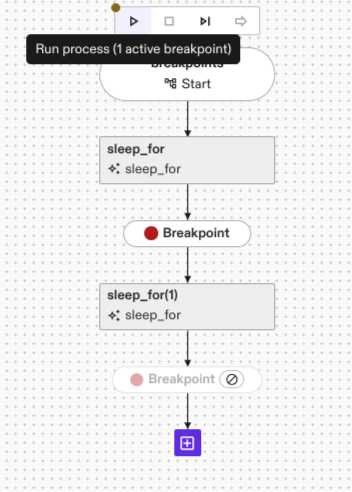
You can run the process up to a breakpoint and then continue with stepwise execution.
When a breakpoint is reached within a parallel execution node branch, execution pauses immediately for that branch. Long-running nodes in other parallel branches continue execution until completion. Once a breakpoint is hit, no new nodes will start executing in any branch until you press the play button again.
To disable, enable, or delete all breakpoints at once, navigate to Process > Debugging in the top menu.
Breakpoints are saved with the process and are not automatically deleted. Before deploying to production, ensure all breakpoints are removed using Process > Debugging > Delete all breakpoints to prevent unintended execution interruptions.
Run parts of a process
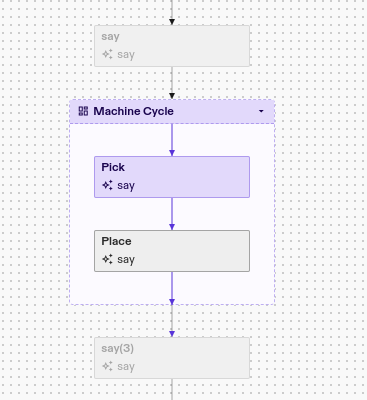
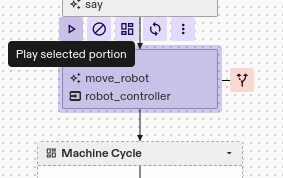
You can execute specific portions of a process by selecting a particular node or structure (such as a group node) and clicking the Play selected portion button.
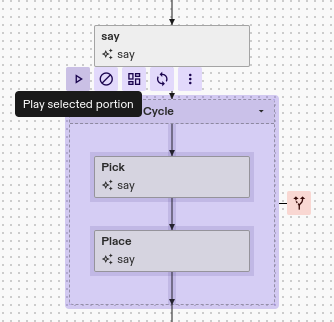
Only the selected portion will execute. All other nodes outside this portion will show as disabled. Execution completes when the selected portion finishes.
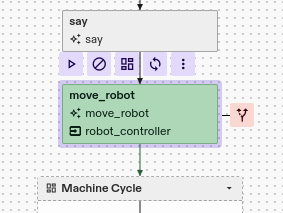
You can also select a single node to execute only that individual skill.
In this case, only the selected skill will run.
Selecting arbitrary collections of individual nodes for partial execution is not supported. To run a collection of sequential nodes without an existing container structure representing the collection, follow these steps:
- Select the nodes you want to run
- Click the Wrap in a group button
- Select the newly created group and start a partial run
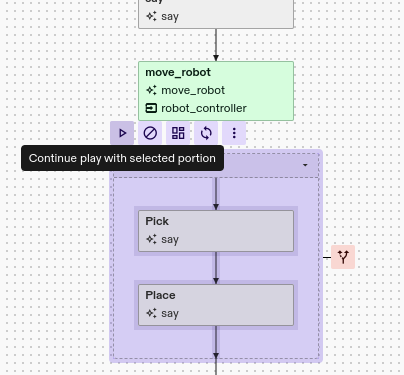
If you have previously run a portion of the process, selecting any node will offer the option to Continue play with selected portion. Only the selected node will execute, but no resets are performed except for configuring the partial run. Notably, variables generated from the previous partial run are retained, allowing you to use them in the newly selected portion.
When running process portions that depend on data from nodes outside that portion, ensure the required data is available from a prior run. If the necessary data is not available, the process portion will fail when attempting to use it as input.
Execution settings
The process details panel provides three execution modes:
- Preview (kinematics only): Visualizes the preview output of each skill synchronized with the skill's predicted execution time.
- Fast Preview: Calls each skill for preview output as quickly as possible without waiting for visualization updates. This mode is useful for rapidly validating process parameterization and outcomes when intermediate state visualization is not required.
- Full (full physics) / Real workcell: Executes all skills on a full physics simulation or, if connected to a real workcell, on the actual hardware. This is the default mode for virtual environments. The mode selection depends on whether the solution runs in virtual or real configuration.
The Preview and Fast Preview modes both execute skills in Preview mode, a specialized implementation that does not require an actual physics simulation or physical equipment.

Process execution time measurement
During process execution, the current elapsed time is displayed in the output panel at the bottom of the solution editor.
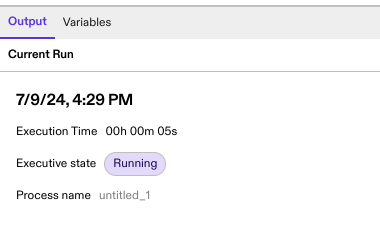
After the process completes, the output panel displays the total execution time.
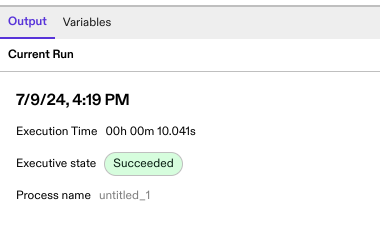
Process execution time reflects the wall-clock time elapsed from process start to completion. This value may vary depending on the execution mode (simulation or real hardware) and the computational resources hosting the solution (virtual machine or Industrial PC).